When:
The rCSI, (similar to the CSI) can be used as a measure of the impact of both emergency and long term interventions. As a lighter tool the rCSI has the advantage of being quicker to use while still reflecting food security nearly as well as the “full” CSI. In most cases for project monitoring purposes the rCSI can be used instead of the longer CSI.
When looking at indicators to measure as part of assessment and targeting processes though the tradeoff is that the reduced CSI is less valuable in identifying the most vulnerable households in a given location because it contains less information—particularly extreme behaviors that may flag greatly increased levels of food insecurity.
Determine the indicator's value by using the following methodology:
1) Conduct individual interviews with a representative sample of the target group members, asking them how many times (in the previous 7 days) they had to use the coping strategies listed below. Use the questions provided in the left column below. Record the frequency by entering relevant number (e.g. 0 – did not have to use the coping strategy; 2 – had to use it twice; 7 – had to use it every day in the past 7 days).
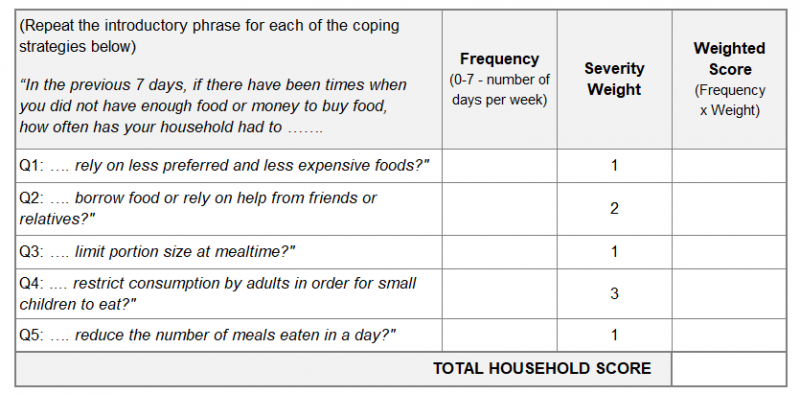
2) During the data analysis, for each coping strategy, multiply the ‘frequency’ by the assigned ‘severity weight’, thereby getting a ‘weighted score’ per each strategy.
3) Add up the scores of all assessed strategies to receive the household’s RCSI score. A high score means an extensive use of negative coping strategies and hence increased food insecurity (the maximum score for the RCSI is 56; this would happen if a household used all five strategies every day for the last 7 days).
4) To calculate the indicator’s value, add the RCSI scores of all the surveyed households and divide this by the total number of surveyed households.
RCSI should be used together with other evidence, especially the Household Hunger Score (HHS), in severe and protracted food security crisis situations.